Cppcheck Usage in Ubuntu

Cppcheck is a static analysis tool for C and C++ code. A static analyser tool detect potential problems in your code which are already visible before its operation at runtime. We embedded Engineers has strong obligation to provide high quality code . Besides resolving standard compiler output warning we should also scan our code through a static analysis tool whenever possible whether provided by the SDK provider or an open source like cppcheck. Its overall target is to catch the following.

  • Undefined behavior
  • Using dangerous code patterns  
  • Coding style

It can be used to identify issues in your code, such as potential bugs, style issues, and performance problems. This can help you write more robust and efficient code. It is an open-source tool, which means that anyone can use it and contribute to its development. Some of the key features of cppcheck include the ability to detect a wide range of issues in your code, the ability to run on multiple platforms, and support for various code standards and coding styles.

Installation Steps


To install cppcheck on Ubuntu, you can use the following steps:


  1. Open a terminal window.

  2. Update the package manager index by running the following command

sudo apt update

  1. Install cppcheck by running the following command:

sudo apt install cppcheck

Once the installation is complete, you can verify that cppcheck is installed correctly by running the following command:
cppcheck --version
To use cppcheck on a codebase, you first need to install the tool on your computer. The installation process varies depending on your operating system, so you should refer to the cppcheck documentation for detailed instructions. Once cppcheck is installed, you can run it on your code by using the following command:
cppcheck [options] [file or directory]
For example, if you want to run cppcheck on a file called main.cpp, you can use the following command:
cppcheck main.cpp
You can also use cppcheck to analyze an entire directory of code by specifying the directory path instead of a file name. For example:

cppcheck /path/to/my/code

There are many options available for cppcheck, which allow you to customize its behavior. For example, you can use the --enable option to enable specific checks, or the --suppress option to ignore certain warnings. You can see a complete list of available options by running the following command:

cppcheck --help

Once cppcheck has finished running, it will display a list of any issues it found in your code. You can then review these issues and take appropriate action to fix them.


Demonstration on an Actual Code 

To demonstrate the usage of cppcheck, I will use a simple C++ program that contains a static rule violation. Here is the code:

#include <iostream>

int main()
{

    char a[10];

a[10] = 0;

    return 0;

}


Now let's compile the code with g++ standard cpp compiler first and then run the cppcheck analyzer on it and see how the output differs 


You can see the difference . With all the warnings enabled standard compiler was unable to find the arrayIndexOutofBound issue whereas cppcheck shined in this case.  


By running cppcheck, we have identified a potential issue in our code that we can fix.

This example was to demonstrate a very simple example. but you can consider using it for larger projects as well . This could be a great tool to analyse a legacy codebase and find out it's potential bugs 

The Full cppcheck manual can be found on this below link as well 


Logic Analyzer Usage

A logic analyzer is a type of electronic test instrument that is used to capture and display signals in a digital circuit. It allows the user to see the timing and value of the signals on the circuit, which can help debug and troubleshoot the circuit. Logic analyzers are often used in conjunction with other test equipment, such as oscilloscopes and multimeters, to provide a complete picture of the behavior of a digital circuit


A logic analyzer typically connects to a PC through a USB or Ethernet interface, and the PC software reads the data from the logic analyzer by communicating with the analyzer over this interface. The software sends commands to the analyzer to configure it for the particular circuit being tested, and the analyzer sends the captured data back to the software for display and analysis. The specifics of how the software communicates with the logic analyzer will depend on the specific model of the analyzer and the software being used.


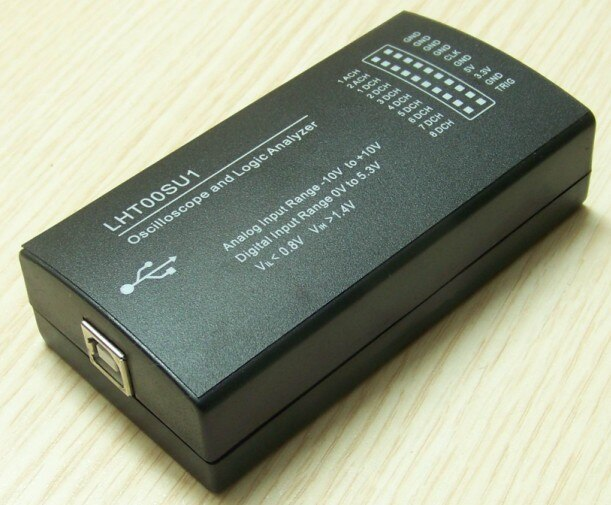
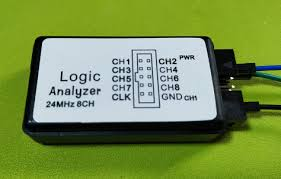
Here I will show how I have used a low cost LHT00SU1 logic Analyzer and setup it in Ubuntu


We will use PulseView as the graphical software 


PulseView is a free, open-source software application for viewing and analyzing signals from electronic circuits. It is often used in conjunction with a logic analyzer, oscilloscope, or other types of test equipment to visualize and analyze the signals in a digital circuit. PulseView is developed by Sigrok, a free and open-source project for signal analysis, and is available for Windows, Linux, and MacOS. It provides a graphical user interface for viewing and analyzing signals, and supports a wide range of devices from various manufacturers.


Sigrok and PulseView are two separate but related software projects. Sigrok is a collection of software libraries and utilities for signal analysis, and provides the underlying infrastructure for connecting to and communicating with electronic test and measurement equipment. PulseView is a graphical user interface built on top of the Sigrok libraries, and provides a convenient way for users to visualize and analyze signals from their circuits.


In order to use PulseView, you will need to have the Sigrok libraries installed, because PulseView relies on the Sigrok libraries to communicate with the test equipment and acquire the signals. Installing both PulseView and Sigrok will ensure that you have all the necessary components to use PulseView to view and analyze signals from your circuits.


To install PulseView and Sigrok in Ubuntu, you can follow these steps:


  1. Open a terminal window on your Ubuntu system.

  2. Install the Sigrok package by running the following command:

$ udo apt-get install sigrok*


  1. Install the PulseView package by running the following command:

$ sudo apt-get install pulseview


  1. Once the installation is complete, you can launch PulseView by running the following command:

$ pulseview


  1. PulseView should open and you can start using it to view and analyze signals from your electronic circuits 


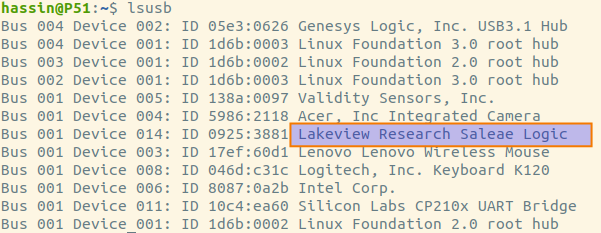
You can check the connection of the Device using the following command 

Or like


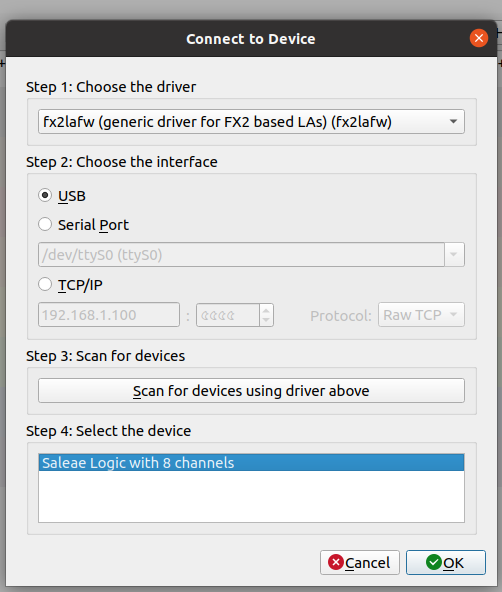
To use PulseView, you will need to connect your logic analyzer or other test equipment to your computer and install the necessary drivers. Once the hardware is set up and the software is installed, you can launch PulseView and follow these steps:


  1. In PulseView, select the type of device you are using from the list of supported devices.

  2. Configure the device settings, such as the sample rate and the channels you want to capture, using the options in the Device Settings panel.

  3. Click the Start button to begin capturing signals from the circuit.

  4. Use the controls in the Signal View panel to view and analyze the captured signals. You can zoom in and out, scroll through the captured data, and apply filters and measurements to the signals.

  5. Use the controls in the Device Control panel to control the operation of the device, such as triggering the capture of a signal or setting the voltage levels on the device's outputs.

  6. Use the File menu to save the captured data or export it to another format for further analysis or sharing.


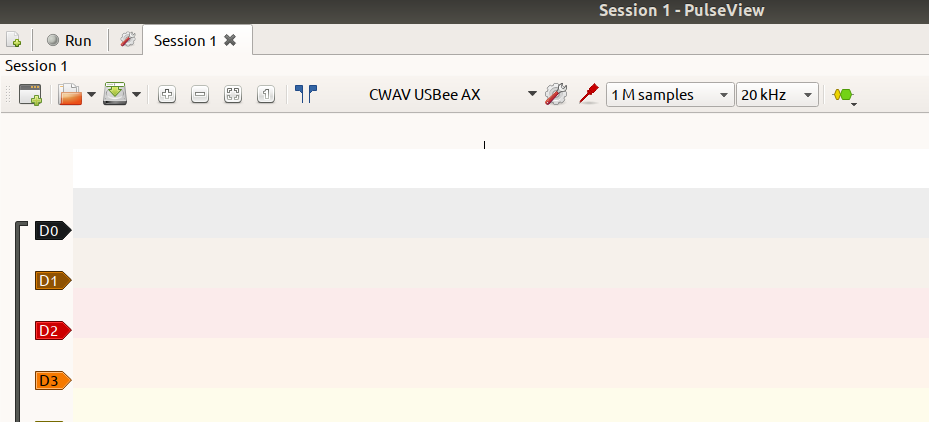
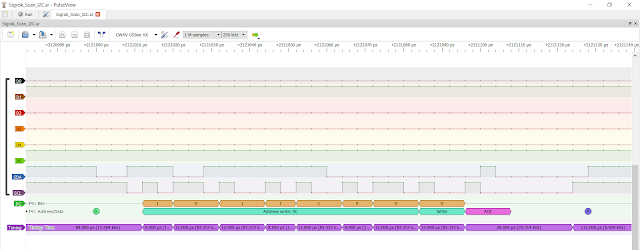
PulseView provides a number of other features and options, and you can explore the application and experiment with its capabilities to learn more about how to use it effectively. An Example Screenshot is given below 


Sigrok software Example Snippet


TDD-ing a Circular Buffer in Google Test Framework

 TDD is quite a popular practice among the software developers but in the firmware development case it's not quite so. One of the reasons behind this is the hurdle in setting up the TDD environment. In this blog post I am not going to explain the importance of doing TDD, rather in this post I will be showing you how we can set up a TDD build environment using google test and  develop a circular buffer following the TDD approach. So Let’s engage in TDD-ing 


gTest Setup 


Firstly we have to install google Test , this is available from the apt-repository 

~$ sudo apt-get install libgtest-dev


The above command will pull down the sources and it is upto us to build the gTest. This process Requires CMake

~$ sudo apt-get install cmake
~$ sudo apt-get install build-essential


Now go to gtest src which got downloaded by apt & build gTest

/usr/src/gtest$ sudo cmake CMakeLists.txt
/usr/src/gtest$ sudo make


Now Lets copy the libraries to system default /usr/lib so that it is accessible from any PATH  

/usr/src/gtest$ sudo cp lib/*.a /usr/lib


Requirements Gathering  


Before starting to code we do have a mental model of the module that we want to develop . The idea of TDD is to write test cases first and then do coding . We will do the same but first let’s write down the requirements of the module in our imagination. 


Circular Buffer spec 

  1. The buffer will be 4 in size 

  2. Data can be put into the buffer 

  3. Data can be read from the buffer

  4. The buffer should be FIFO in nature 

  5. The buffer should be fixed sized 

  6. User should know if buffer is empty

  7. User should have the option to clear the buffer


TDD project Folder Structure 


The Project folder has the following structure 


Now let’s look what each of the elements are 


CMakeLists.txt

This is the CMake file required for the overall build . 


It has linkage to the gTest binaries and rules to add the module headers under include folder 

CBuffer.h

This is the Module Header File

CBuffer.cpp

This is the Module Implementation File 

main.cpp

The Test Driver and the Test framework

It contains all the Test Cases  


Let’s create all the folders and files 


~/$ mkdir circular-buffer
~/$ cd circular-buffer/
~/circular-buffer$ mkdir include src
~/circular-buffer$ touch include/CBuffer.h
~/circular-buffer$ touch src/CBuffer.cpp
~/circular-buffer$ touch src/main.cpp

~/circular-buffer$ touch CMakeLists.txt 


Linking gTest & CMake 


Now we will prepare the CMake makefile so that our sources gets linked with the compiled gTest libraries that we built at top . This CMake file is very easy to understand . the contents are 


CMakeLists.txt 

cmake_minimum_required(VERSION 2.8.9)
project (circular-buffer-test)

#For the static library:
set ( PROJECT_LINK_LIBS libgtest.a libgtest_main.a )
link_directories( /usr/lib )

set(CMAKE_CXX_FLAGS "-Wall -std=c++11 -pthread")

#Bring the headers
include_directories(include)

#if multiple files
file(GLOB SOURCES "src/*.cpp")
add_executable(circular-buffer-test ${SOURCES})

target_link_libraries(circular-buffer-test ${PROJECT_LINK_LIBS} )

message("CMAKE_CXX_FLAGS is ${CMAKE_CXX_FLAGS}")
message("CMAKE_CXX_FLAGS_DEBUG is ${CMAKE_CXX_FLAGS_DEBUG}")
message("CMAKE_CXX_FLAGS_RELEASE is ${CMAKE_CXX_FLAGS_RELEASE}")


Test Driver Structure 


Now that our CMakeFile is ready we will prepare the main.cpp the Test Driver File .


main.cpp 

#include <iostream>      //standard header inclusion
#include <gtest/gtest.h> //google test header inclusion

#include "CBuffer.h"     //module header inclusion

int main(int argc, char** argv) {
  // The following line must be executed to initialize Google Mock
  // (and Google Test) before running the tests.
  ::testing::InitGoogleTest(&argc, argv);
  return RUN_ALL_TESTS();
}


Now let’s put some minimum code in our sources and check if build passes


CBuffer.h

#ifndef CBUFFER_H_   /* Include guard */
#define CBUFFER_H_


#endif


CBuffer.cpp

#include "CBuffer.h"


Build System Check 

Now let’s check if the Test Build system prepared so far works or not

~/circular-buffer$ cmake .


The job of CMake is to create a makefile


Let’s use make to build our executable binary 

~/circular-buffer$ make clean
~/circular-buffer$ make


Now run the executable created

~/circular-buffer$ ./circular-buffer-test
[==========] Running 0 tests from 0 test suites.
[==========] 0 tests from 0 test suites ran. (0 ms total)
[  PASSED  ] 0 tests.


Writing The First Test Case


In TDD we have to follow 4 major steps 

  1. Setup 

  2. Exercise

  3. Verify

  4. Cleanup 


Each Test Case should go through the above steps 


  • We will write test cases for spec 6 & 7 

  • We will call clear function to empty out the buffer 

  • And then check if buffer is empty 


Now let’s compile again 

$ make clean && make


You will get compilation error 


Getting compilation/build errors first is also part of The TDD process. The mandatory rule is to write test cases first no matter what . The hidden gem of TDD is that by writing the test cases first we get to think about the module API calls and the code grows with this approach 


Now Let’s put code

CBuffer.cpp

CBuffer.h 


Next step is to add our 3rd step Verify

main.cpp


Now Compile again and you will see successful build output 

$ make clean && make 


Let’s run the executable binary 

~/circular-buffer$ ./circular-buffer-test


This time we see Test Case output of the verification stage. In this step we see Test cases getting failed This is the way TDD development progresses. We observe code getting failed and then we write code to pass the test cases. This is what we are going to do now 


CBuffer.cpp


Add the orange marked code and Now if you compile and run the test executable again then you will see that the test have passed 


Similarly you will be adding all the other test cases and code will get developed along the away 

I am not going to explain all the other test cases here anymore as this has already been a very long post. You can find the rest of the test cases along with all the other source files available in this link 

https://github.com/hassin23ayz/TDD-practice/tree/master/cpp/circular-buffer 


Categories

Pages

Firmware Engineer

My photo
Works on Firmware, Embedded Linux, Smart Metering, RTOS, IoT backend

Contact Form

Name

Email *

Message *

Copyrighted by Hassin. Powered by Blogger.