After Flashing firmware to a microcontroller we normally test & debug the behavior of the application using either an oscilloscope, logic analyzer, or seeing and probing everything manually. Another popular mechanism is to connect a USB UART module to a dedicated UART peripheral and see everything on the PC side using Serial Terminal Software.
But ...
- What if we need to deep dive and see what is happening inside the processor?
- What if we want to debug through breakpoints set at source code and navigate through the code just like a Regular Software Engineer Does?
If your answer is yes then this post might be helpful.
Microcontrollers are resource-constrained small computers and debugging at the CPU level is not so common . over the years' semiconductor manufacturers have jointly developed a protocol named JTAG to establish a common standard that we all can follow to debug these tiny computers. Not all the mcus in the market have the JTAG stack embedded inside the silicon but nowadays it has become more mainstream. We will first discuss the common concepts behind JTAG and then look into how we can set up everything. Our Target platform will be ESP32.
JTAG stands for Joint Test Action Group
The CPU inside an MCU is equipped with an On-Chip Debug Module. This on-chip debug module understands JTAG protocol and can communicate with the CPU under the rules set by JTAG specification. For example, our target MCU ESP32 has an on-chip debug module.
Then this on-chip debug module is routed to JTAG pins which are exposed at the external side of an MCU. The naming convention and behavior of these pins are as per the JTAG standard.
JTAG specification allows us to
- Program the microcontroller
- Halt the CPU
- inspect Microcontroller Registers and memory
- Define breakpoints
- Allows single stepping through the code
- Allows sending debug string messages [ e.g. ARM CPU has ITM (instrumentation trace macro-cell) ]
- Tracing
Client and Server Model
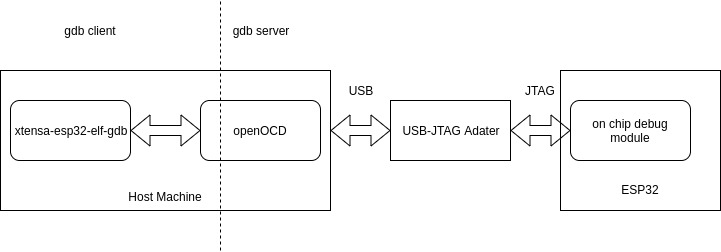
From a high-level point of view, there are 2 entities: At one end we have the microcontroller and at the other end we have our development machine ready to debug the target MCU. We need to visualize The Host side PC as a client and the microcontroller as a server.
Required Tools
By this time we have well understood the system-level topologies, now let's look into what kind of software we need. We will be using GDB ( GNU Debugger ) as our debugger software.
GDB has a GDBClient program for almost Every kind of CPU architecture. During the installation of ESP-IDF, it got automatically installed in our system.
At the microcontroller end, The on-chip-debug module itself will not act as a server, we would need 2 more components in between. one is a hardware component named JTAG-Adapter and another one is a software component named OpenOCD. Have a look at the following diagram to understand the whole idea
The OpenOCD got also installed during esp-idf setup. you can look into my previous blog post on setting up ESP-IDF SDK setup from here
ESP-IDF setup in Ubuntu
J-Link by Segger Embedded is a very common & popular JTAG adapter. we will use it in our setup.
JLink & ESP32 JTAG connection
A JTAG Port has a fixed set of PIN allotments. There are a couple of variants, of them we will follow the 20-pin option
Connect your ESP32 to the JLINK as per the following table
JLink | ESP32 |
VTref | 3.3V |
nTRST | EN |
TDI | GPIO12 |
TMS | GPIO14 |
TCK | GPIO13 |
RTCK | GND |
TDO | GPIO15 |
Pin No 4 [GND] | GND |
My Connection Setup Looked like this
 I followed the following link
Now Plugin JLink to your USB port
JLink Driver Installation
I assume that you have not installed JLink Before so let's install the driver for our ubuntu host
it will get downloaded to your Downloads folder, so CD into it and use dpkg to install
~/Downloads$ sudo dpkg -i JLink_Linux_V650b_x86_64.deb |
(Reading database ... 206817 files and directories currently installed.)
Preparing to unpack JLink_Linux_V650b_x86_64.deb ...
Removing /opt/SEGGER/JLink ...
Unpacking jlink (6.502) over (6.502) ...
Setting up jlink (6.502) ... |
Check JLink Rules
60-vboxdrv.rules 70-snap.electronic-wechat.rules
70-snap.canonical-livepatch.rules 99-jlink.rules
70-snap.core.rules 99-USBAsp.rules |
If Jlink rules are automatically added like above then JLink is installed properly.
Now connect your ESP32 devkit to host over USB
Program ESP32 over JTAG & OpenOCD
The focus of this post is to debug ESP32 via JTAG but we can also Program the microcontroller via JTAG port. When we setup ESP-IDF first we got many examples as part of the SDK. we will program the usual Blink example application.
CD into the project and load esp-idf environment
~/esp/esp-idf/examples/get-started/blink$ . ~/esp/esp-idf/export.sh |
This will load esp-idf compiler toolchains and openocd executables in our shell environment
Check JTAG connection with ESP32 via OpenOCD
Then run the following command to test jLink Connection to ESP32
~/esp/esp-idf/examples/get-started/blink$ openocd -f interface/jlink.cfg -f board/esp-wroom-32.cfg |
Open On-Chip Debugger v0.10.0-esp32-20190708 (2019-07-08-11:03)
Licensed under GNU GPL v2
For bug reports, read
http://openocd.org/doc/doxygen/bugs.html
adapter speed: 20000 kHz
Info : Configured 2 cores
esp32 interrupt mask on
Info : Listening on port 6666 for tcl connections
Info : Listening on port 4444 for telnet connections
Info : J-Link V9 compiled Jun 2 2222 22:22:22
Info : Hardware version: 9.40
Info : VTarget = 3.291 V
Info : Reduced speed from 20000 kHz to 15000 kHz (maximum).
Info : Reduced speed from 20000 kHz to 15000 kHz (maximum).
Info : clock speed 20000 kHz
Info : JTAG tap: esp32.cpu0 tap/device found: 0x120034e5 (mfg: 0x272 (Tensilica), part: 0x2003, ver: 0x1)
Info : JTAG tap: esp32.cpu1 tap/device found: 0x120034e5 (mfg: 0x272 (Tensilica), part: 0x2003, ver: 0x1)
Info : esp32: Debug controller 0 was reset (pwrstat=0x5F, after clear 0x0F).
Info : esp32: Core 0 was reset (pwrstat=0x5F, after clear 0x0F).
Info : esp32: Debug controller 1 was reset (pwrstat=0x5F, after clear 0x0F).
Info : esp32: Core 1 was reset (pwrstat=0x5F, after clear 0x0F).
Info : Listening on port 3333 for gdb connections |
If you get an output like the above then connections are okay and openocd has been able to communicate with the on-chip debug module of esp32
Program ESP32 using JLink
You can also program the application binary over JTAG connection, we will build and program the simple “blink” example application.
Build the program first using idf.py
~/esp/esp-idf/examples/get-started/blink$ idf.py build |
Now program it
~/esp/esp-idf/examples/get-started/blink$ openocd -f interface/jlink.cfg -f board/esp-wroom-32.cfg -c "program_esp32 build/blink.bin 0x10000 verify reset exit" |
Here the ideal 0x10000 address was set
If the setup is okay then you will see output like this
** Programming Started **
auto erase enabled
Info : Target halted. PRO_CPU: PC=0x400916EE (active) APP_CPU: PC=0x40000400
Info : Flash mapping 0: 0x10020 -> 0x3f400020, 24 KB
Info : Flash mapping 1: 0x20018 -> 0x400d0018, 74 KB
Info : Target halted. PRO_CPU: PC=0x400916EE (active) APP_CPU: PC=0x40000400
Info : Auto-detected flash size 4096 KB
Info : Using flash size 4096 KB
Info : Target halted. PRO_CPU: PC=0x400916EE (active) APP_CPU: PC=0x40000400
Info : Target halted. PRO_CPU: PC=0x400916EE (active) APP_CPU: PC=0x40000400
wrote 151552 bytes from file build/blink.bin in 5.383243s (27.493 KiB/s)
** Programming Finished **
** Verify Started **
Info : Target halted. PRO_CPU: PC=0x400916EE (active) APP_CPU: PC=0x40000400
read 148384 bytes from file build/blink.bin and flash bank 0 at offset 0x00010000 in 2.188784s (66.204 KiB/s)
contents match
** Verified OK **
** Resetting Target ** |
Now you will see that the board’s default LED(connected to GPIO2) is blinking